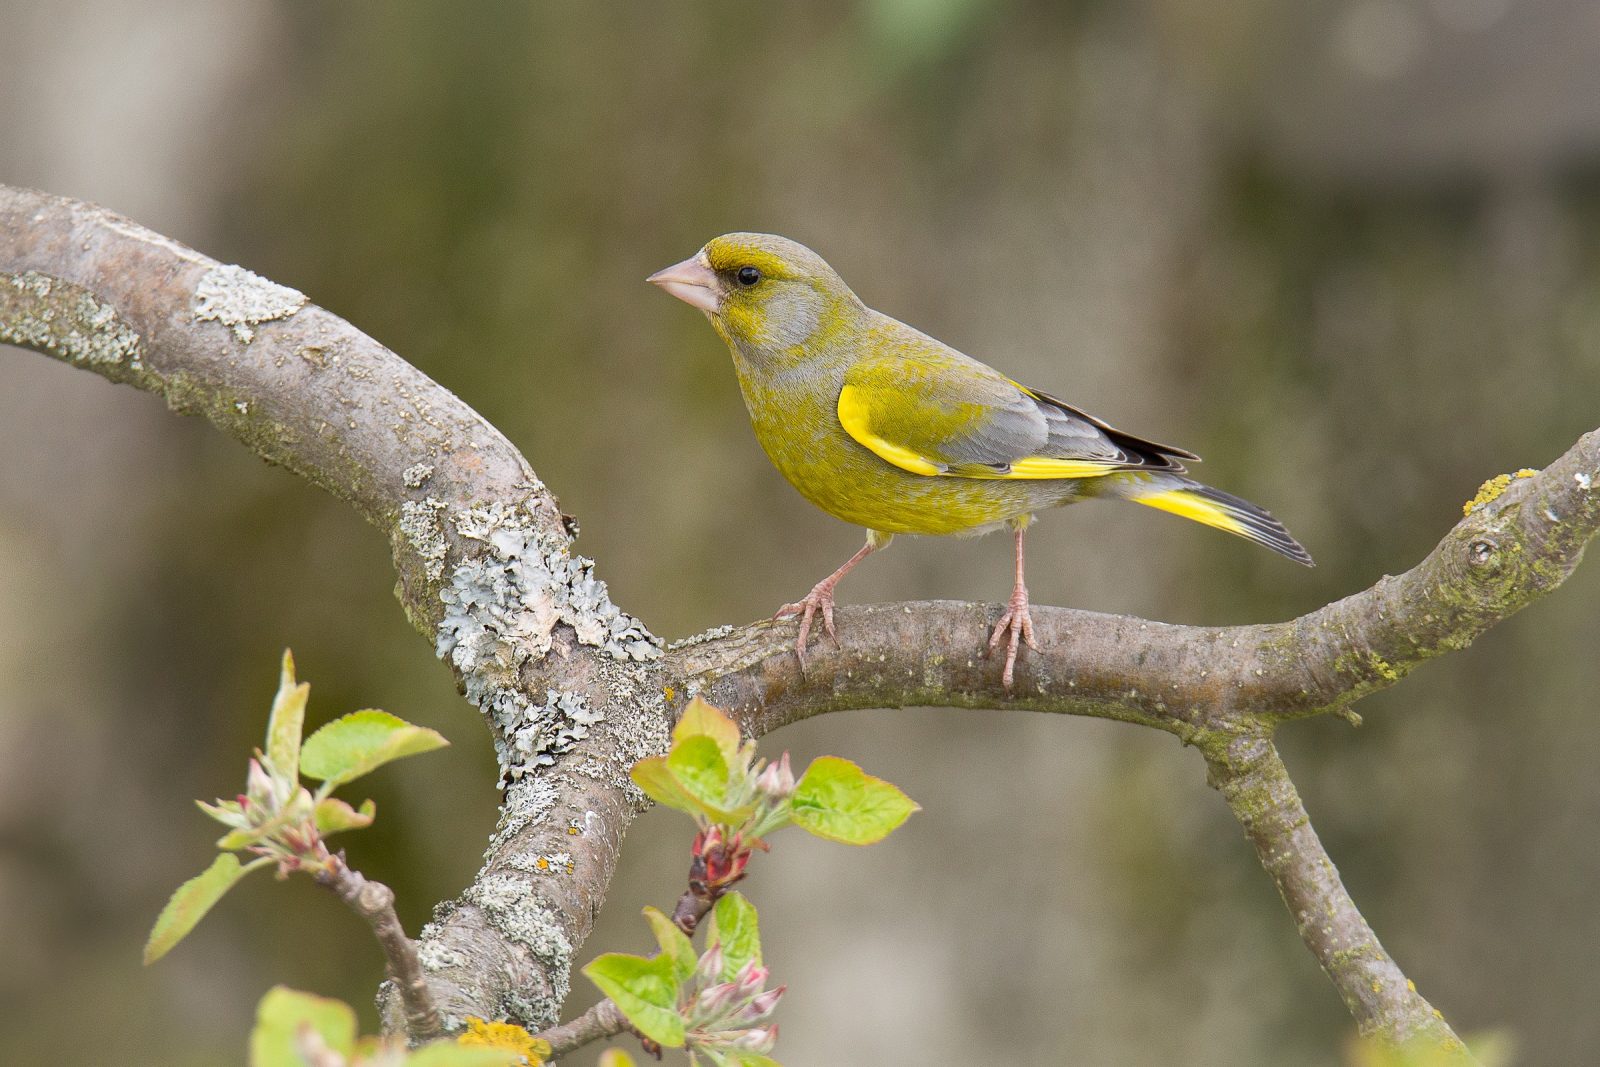
The decline of the European Greenfinch (Chloris chloris) population in Europe may be linked to the appearance of the infectious disease called trichomonosis. Greenfinches usually get infected on birdfeeders. Photo by Václava Štofflová
Trends of common birds in Europe, 2022 update
November 23, 2022
This report presents updated population trends and indices of 170 common European bird species for the period 1980–2021 produced by the Pan-European Common Bird Monitoring Scheme (PECBMS) in 2022. The species trends presented are for an extended period (from 1980 onwards until 2021) and the last ten years (2012–2021).
The decline of the European Greenfinch (Chloris chloris) population in Europe may be linked to the appearance of the infectious disease called trichomonosis. Greenfinches usually get infected on birdfeeders. Photo by Václava Štofflová
Download European species indices and trends till 2021 (Data Provision and Co-Authorship Policies applies).
Data
In 2022, a reliable European index was produced on 170 species, the same number of species as in the last update in 2021.
This time, we added new data to our dataset: new country Andorra delivered their data for 2011–2021.
The list of 30 countries provided their data for this update: Andorra, Austria, Belgium, Bulgaria, Croatia, Cyprus, Czech Republic, Denmark, Estonia, Finland, France, Germany, Greece, Hungary, Italy, Latvia, Lithuania, Luxembourg, Netherlands, Norway, Poland, Portugal, Republic of Ireland, Romania, Slovenia, Slovakia, Spain, Sweden, Switzerland, United Kingdom.
The countries provided the data for different periods; see Methods, chapter 2.3. Types of supranational results that PECBMS produces or check the List of countries at the individual species graphs.
Methods
A detailed description of computation steps and methods is available in the special section Methods, in Chapter 1. National species indices and trends and Chapter 2. Supranational species indices and trends.
Species habitat classification for main habitat types (farmland, forest, and other) is described in Methods, chapter 3, Box Species Selection and Classification.
Results
We present long-term and ten-year trends and slopes in the table. The Long-term Slope is calculated over the period 1980–2021, but the starting years of this long period vary from 1980 to 1998 (as specified in the Species notes below the table of trends). In parallel, the Long-term Trend represents a change (in %) in an index value between the first and the last year of this long period. The Ten-year Slope is calculated over the previous ten years, i.e. 2012–2021. Similarly, Ten-year Trend represents a change (in %) in an index value between the first and the last year of the period of the previous ten years.
The table summarises the updated European species indices, long-term and ten-year trends and slopes, and the species habitat classification. For explanations to the table, please also see pop-up windows that appear after clicking on the notes shown in selected species names as an upper index.
To generate a graph for the selected species, tick the checkbox at the left side of the species name and click the Show button above the table to confirm and proceed with your selection. You can draw graphs for several selected species in separate graphs or at once in one graph – choose the option from All data in one graph above the table. If you wish to Show confidential limits, you may choose this option only if you selected only one species to be shown in a graph. You can also quickly deselect your choice (Reset). The list of countries and periods for which the countries provided the data can be found in individual species graphs (Countries). You can order species trends by alphabet or taxonomic classification, see the Order button at the head of the table, and select alphabet or taxonomy.
Download the latest European species indices and trends
Indices and trends for 170 European bird species are freely available for download in Excel sheets (Data Provision and Co-Authorship Policies apply). We would be grateful if you acknowledged the data source as EBCC/BirdLife/RSPB/CSO when using the data.
We appreciate your help in keeping evidence of the usage of our results. For this purpose, please fill in the simple registration form after downloading the data files.
Download European species indices and trends till 2021.
So that you know, the data is licensed under a Creative Commons license CC BY-NC 4.0 and is governed by applicable copyright law (Creative Commons Legal Code). Creative Commons. January 9, 2008. Retrieved February 22, 2010.
Species’ scientific and common names and species taxonomic order follows the HBW and BirdLife Taxonomic Checklist.
Note: We recommend a cautious interpretation of year-by-year changes in the index values, and readers should also pay attention to species legend. For any use of the results presented in this report, we strongly recommend you consult the PECBMS coordination unit (klvanova@birdlife.cz).
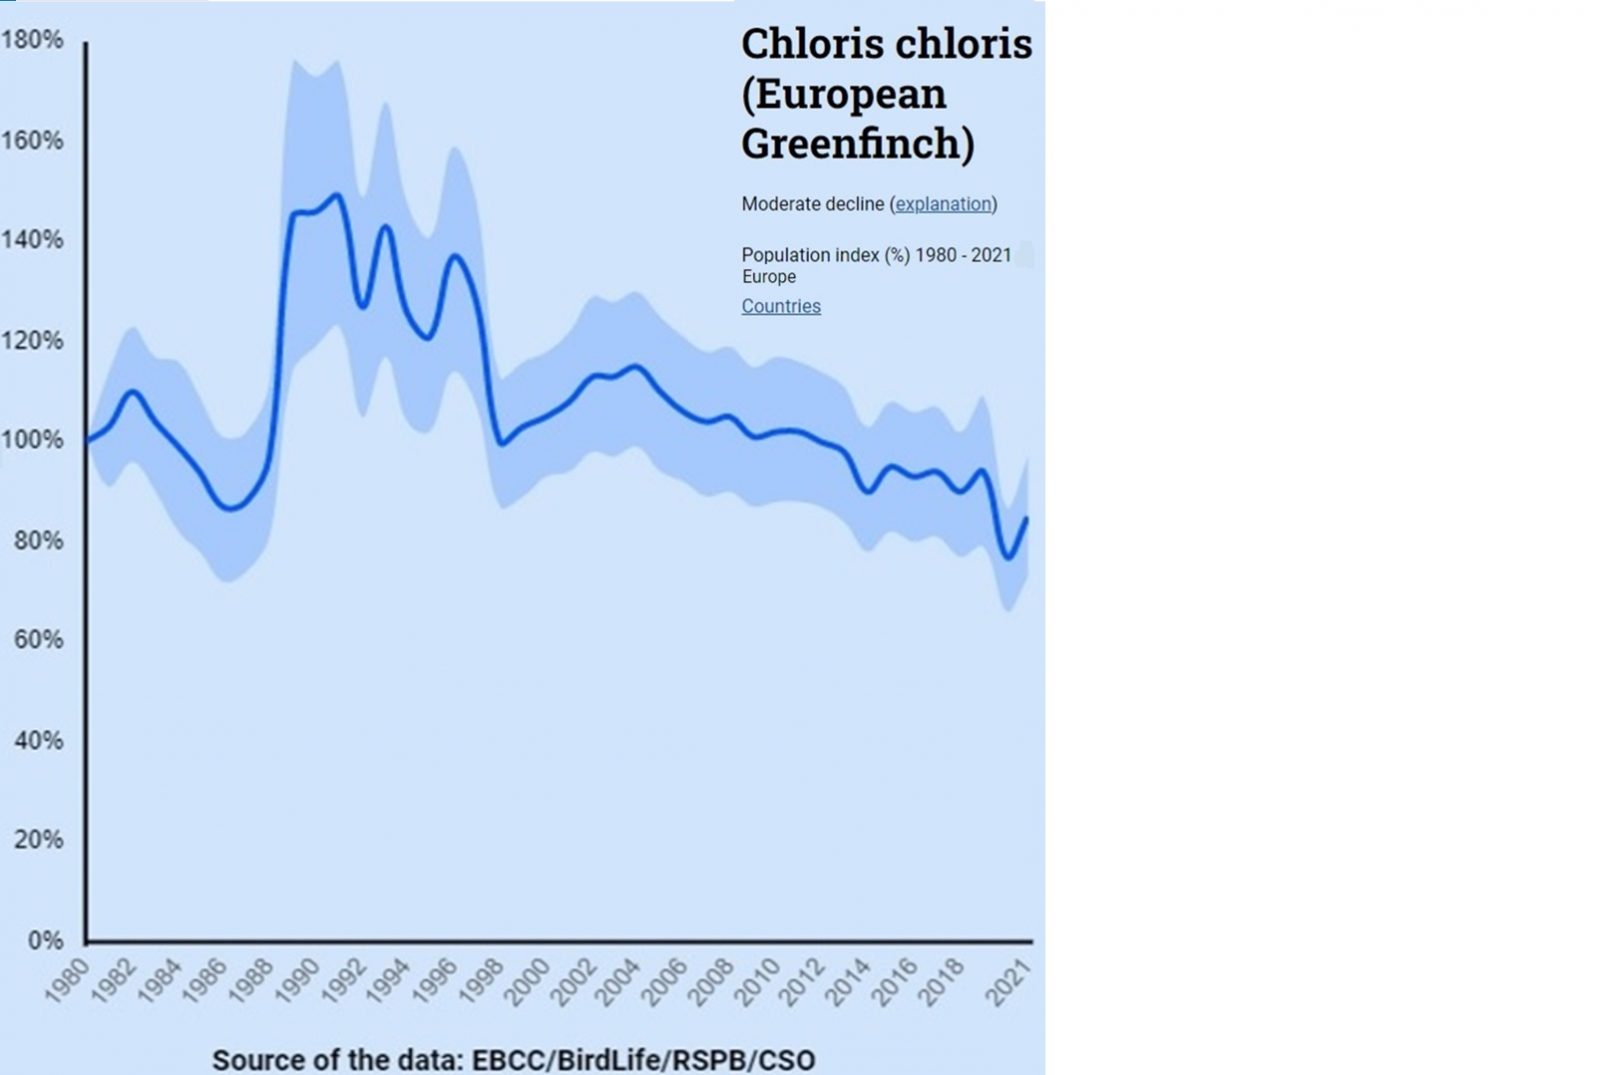
European Greenfinches started to decline after 2005 in Great Britain and Fennoscandia, where infectious trichomonosis appeared.