
The title page of the leaflet shows the European Turtle-dove which represents once common but recently declining farmland species. Photo by Jiří Bartoš (bartosphoto.cz).
New leaflet State of common European breeding birds 2018 produced
March 27, 2019
In March we have produced a new leaflet presenting the trends of 170 common European bird species based on data from 28 countries covering 37 years (1980–2016). The leaflet summarises outputs of this 2018 data update and presents a nice example of the use of bird monitoring and atlasing in species conservation. PECBMS and EBBA2 data on the European Turtle-dove helped to identify Priority Intervention Areas for this species.
The title page of the leaflet shows the European Turtle-dove which represents once common but recently declining farmland species. Photo by Jiří Bartoš (bartosphoto.cz).
You may download the pdf version of the leaflet:
for reading as a pdf in your computer (or another electronic device)
Of the 170 species covered, in long-term 52 increased moderately, 65 declined moderately and one steeply, while 46 remained stable. In six cases the species trends remained uncertain.
Of the 170 species, only 168 are included in the common bird indicators for Europe and the EU. The Cyprus wheatear (Oenanthe cypriaca) and Cyprus warbler (Sylvia melanothorax) have been excluded as they are endemic species for Cyprus.
All common species (168 sp.) declined by 15 % since 1980, common forest birds (34 sp.) declined by 6 % and the worst decline continued in common farmland birds (39 sp.), of which we have lost 57 % since 1980.
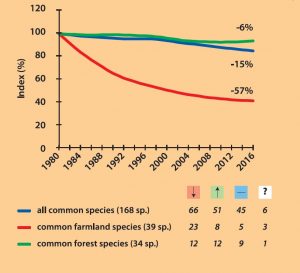
European wild bird indicators. The numbers in italics show the numbers of species in each indicator which are moderately or steeply declining, moderately or strongly increasing, stable and uncertain.
Bird monitoring and atlasing is helpful in the identification of threats and also in steering conservation actions: using the data collected for the Second European Breeding Bird Atlas (EBBA2), experts modelled probability of European Turtle-dove occurrence in Europe on 10×10 km grid. The map was then used to identify Priority Intervention Areas (PIAs) (Herrando et al. 2018), which indicate where conservation interventions might be best directed.
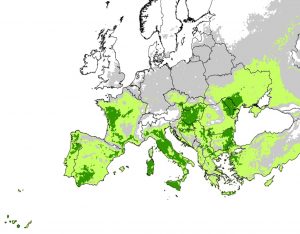
Priority Intervention Areas (PIAs) for European Turtle-dove. The intensity of the green colour indicates modelled probability of species occurrence.
We thank to
- the thousands of skilled volunteer counters responsible for data collation;
- Arco van Strien, Adriaan Gmelig Meyling and Tom van der Meij (Statistics Netherlands), Jana Škorpilová and Maaike de Jong who contributed with final data analysis and computation procedure;
- Richard D. Gregory, Mark Eaton and Carles Carboneras for their help and valuable comments on the leaflet;
- Jiří Bartoš (bartosphoto.cz), Martin Mesnarowski (photomecan.eu), Ondřej Prosický (naturephoto.cz) and Zdeněk Jakl (500px.com/zdenekjakl) for their beautiful photos which they provided for this leaflet;
- Anne Teller, Richard D. Gregory, Ruud P. B. Foppen, David G. Noble and Zdeněk Vermouzek for help and general support.
If you wish, ask for the printed version of the leaflet via e-mail: klvanova@birdlife.cz. We apologize for a mistake in the printed version of the leaflet. In the legend for the graph of wild bird indicators, there are the colours for the common species and farmland species confused. All common birds should be in blue and farmland birds should be in red. We are very sorry for this inconvenience! The pdf for download is corrected.
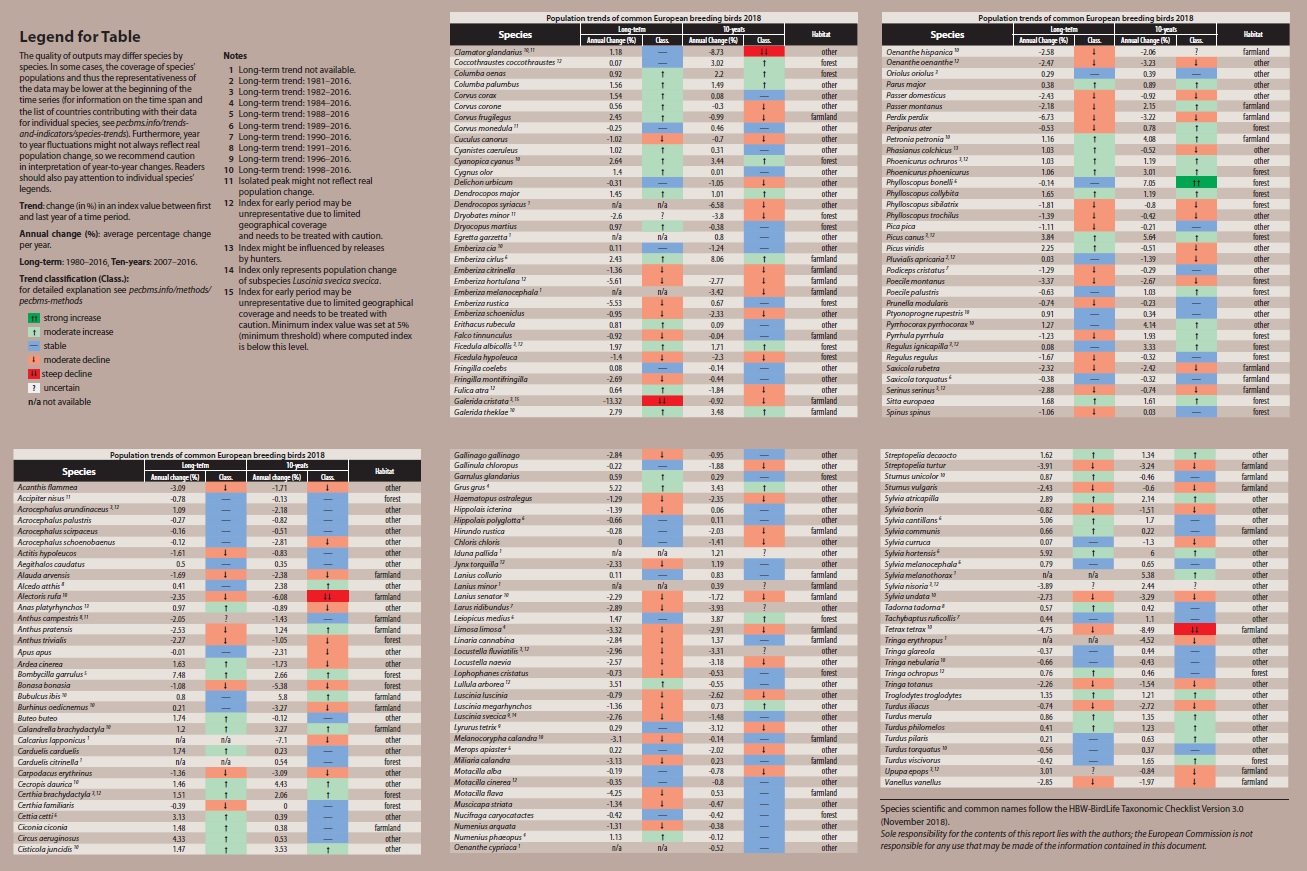
In the table Population trends of common European breeding birds 2018 the annual change (%), i. e. average percentage change per year, and trend classification for 170 species is given as well as the habitat type which each species inhabits.
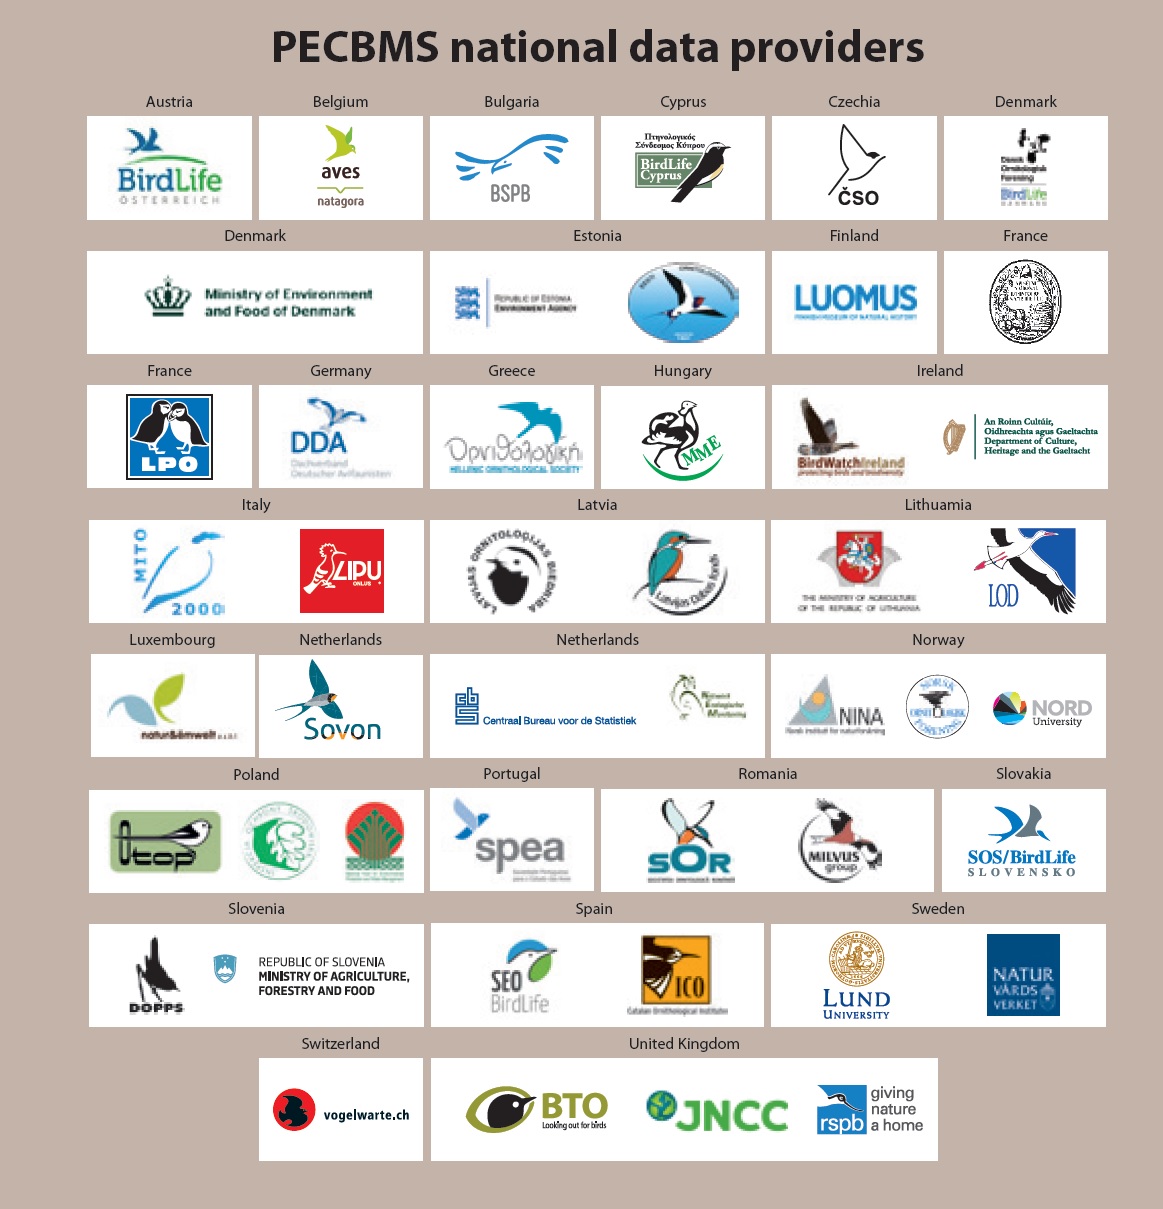
PECBMS national data providers for the 2018 update which is based on data covering the period 1980–2016.

Common Firecrest (Regulus ignicapilla) has an extremely large range. The population of this forest species appears to be stable in the long-term perspective and even moderately increasing during the last ten years. Photo by Martin Mecnarowski (photomecan.eu).
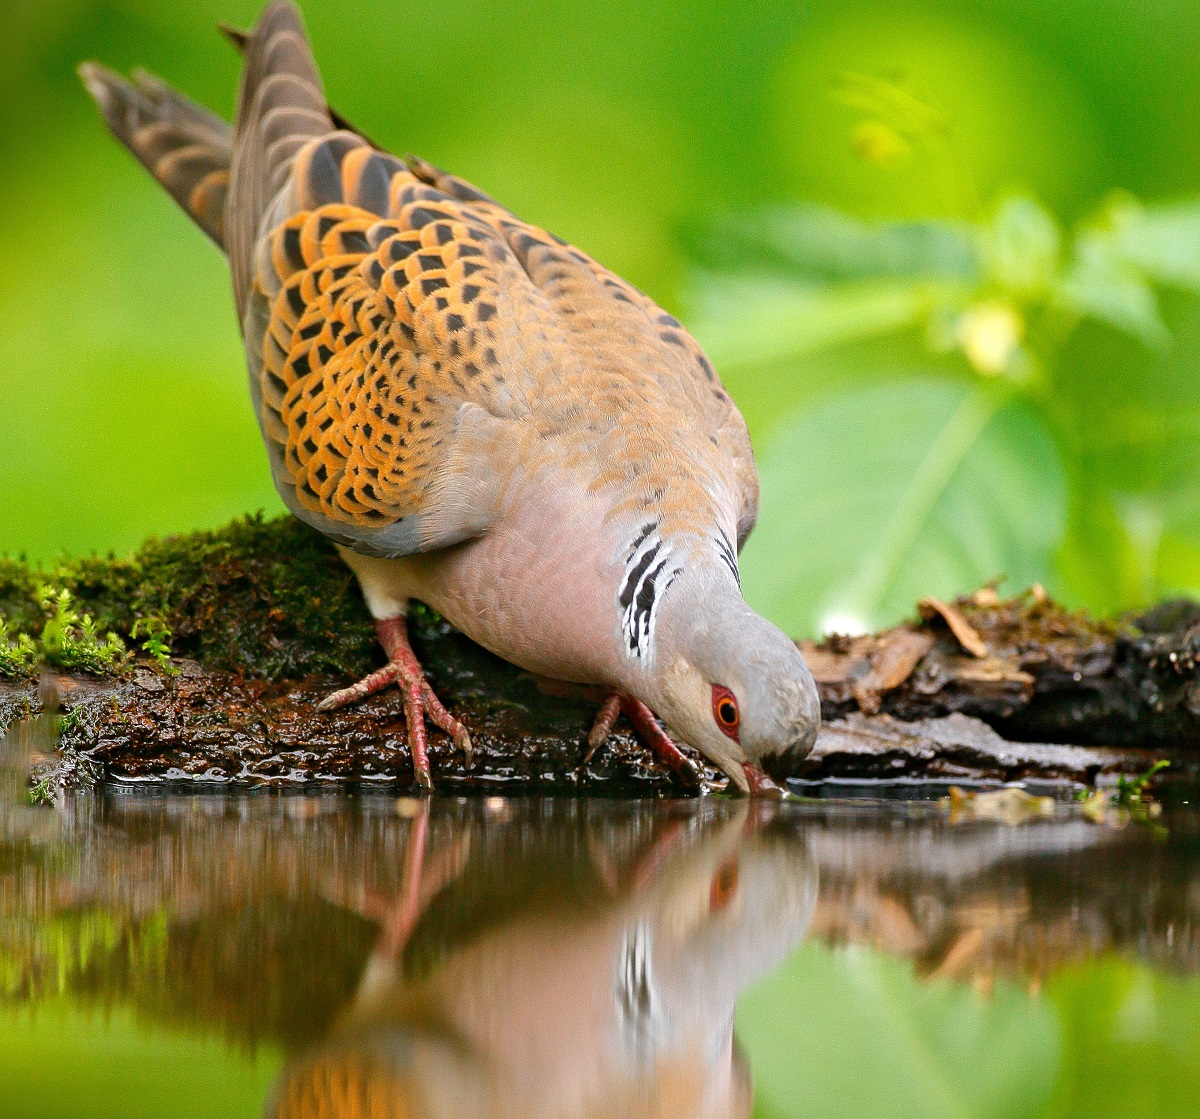
European Turtle-dove (Streptopelia turtur) is globally threatened; it was uplisted to Vulnerable on the IUCN Red List in 2015.
Photo by Ondřej Prosický (naturephoto.cz).
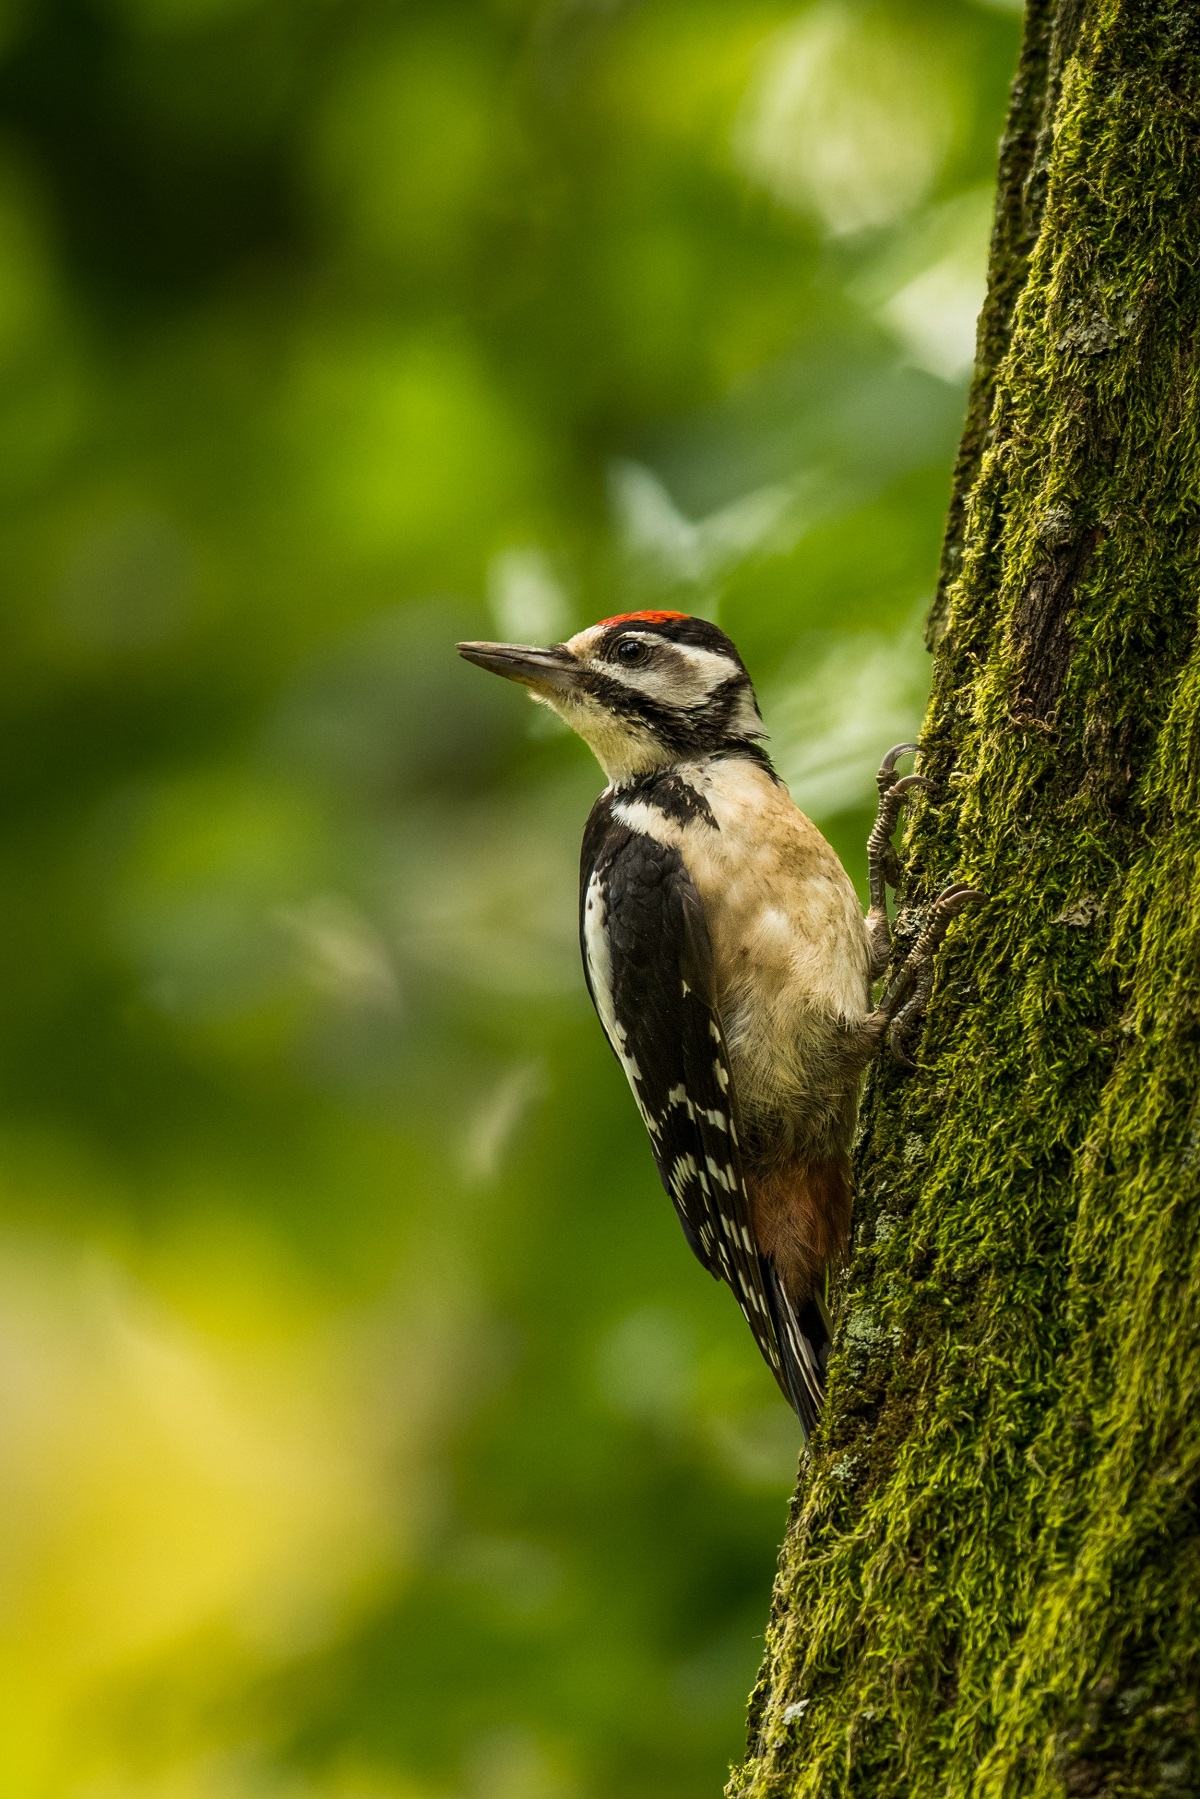
The data for the Great Spotted Woodpecker (Dendrocopos major) come from all but one country contributing to PECBMS (the species does not occur in Cyprus). In Europe, the population is increasing moderately by approximately 1% per year. Photo by Zdeněk Jakl (500px.com/zdenekjakl).