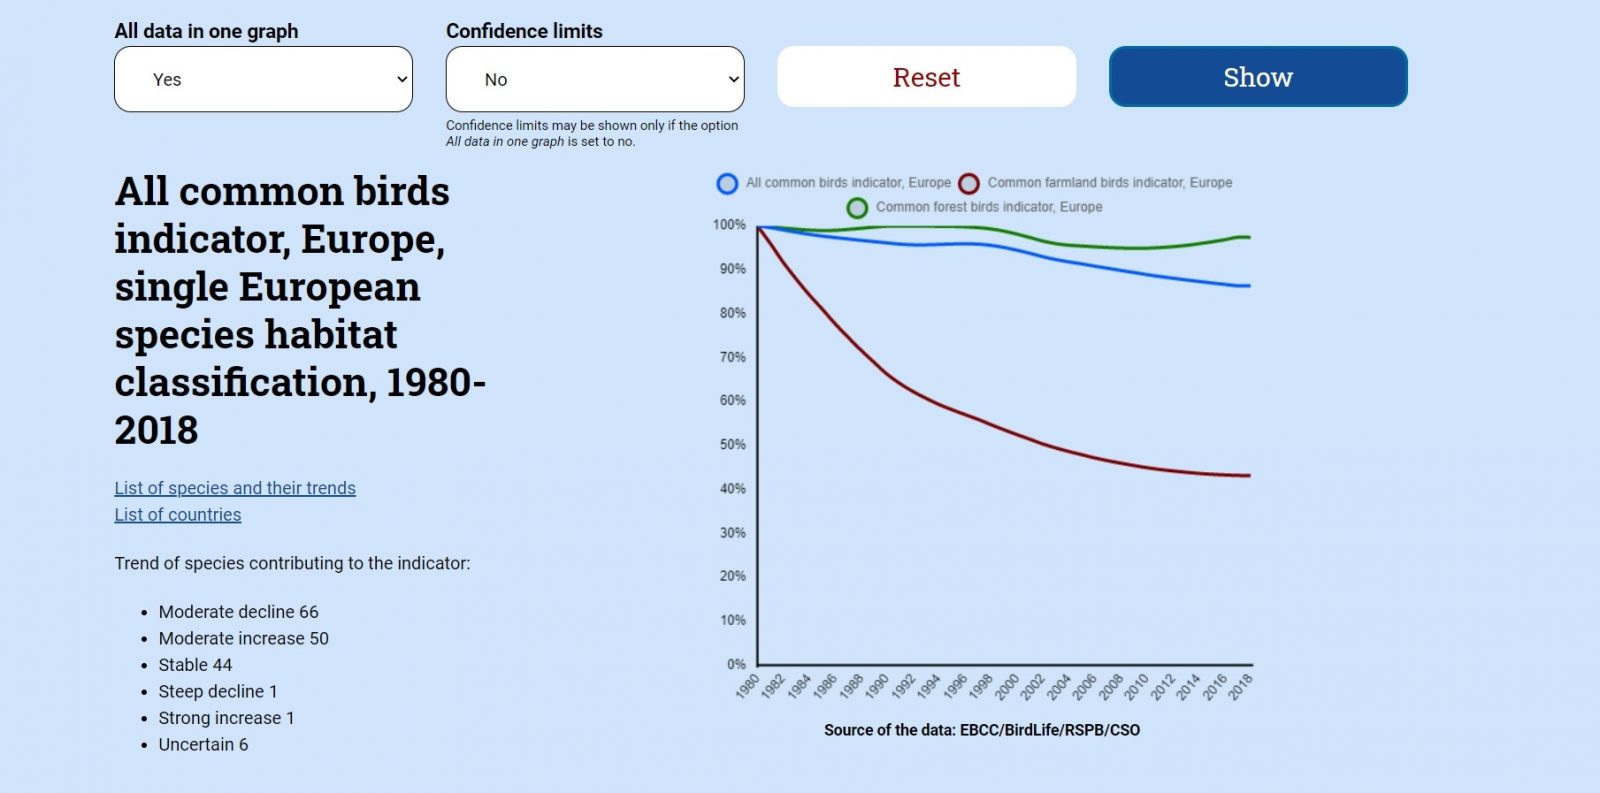
The 2020 Indicators Update shows the continuation of decline in the farmland species. Note, that the value of the indicators for the year 2018 is an estimate.
European wild bird indicators, 2020 update
June 30, 2020
The Pan-European Common Bird Monitoring Scheme (PECBMS) presents a set of updated European wild bird indicators for the period 1980–2017 and estimates for the year 2018. The values of indicators for the year 2018 are estimated by moving average in the whole set of indicators. The reason for the estimation is a recent general PECBMS data set revision and implementation of the new tools running in the software environment for statistical computing and graphics R (RTRIM and RSWAN). Quality of the input data and a transparent methodology of indicators´ computation is among our top priorities. We aim for a deep data set revision implementing quality measures to make the production of the indicators faster, more transparent, and more efficient.
The 2020 Indicators Update shows the continuation of decline in the farmland species. Note, that the value of the indicators for the year 2018 is an estimate.
The indicators are computed for Europe and its regions (West, North, Central & East and South Europe), and EU, New and Old EU states for common farmland, common forest, and all common birds. Both single European and BioGeo regional species habitat classification are used to assess if each bird species belongs to farmland, forest, or another indicator.
Data
For the 2020 Indicators Update, we used the indicators for the period until 2017 from the former year (2019 update). The estimated value of the indicators for the year 2018 was added to the data.
Therefore, information on the 2020 Indicators Update resembles the 2019 update. The indices of European common birds were used for computation of European indicators. For the computation of regional indicators for West, North, Central & East, and South Europe or EU, New and Old EU states, the regional and EU individual species indices were used, respectively. Although we produce European, EU and regional indices for 170 species, two species (Oenanthe cypriaca and Sylvia melanothorax) haven´t been included in the common bird indicators for Europe, EU, and regions since they are endemic species of Cyprus and so not common for the whole of Europe. Consequently, only 168 species are included in the common bird indicators. The number of species included in the common farmland bird indicators (39 farmland species) and common forest bird indicators (34 forest species) for Europe and the EU remained the same as last year.
Methods
Indicator values for the year 2018 are not updated in a classical way, but an estimate is used instead. Indicators for all the regions are estimated by the moving average. For each year the mean of year-before-last and the recent year was calculated. So, for the estimate we used values from the last four years: mean for the year 2016 was calculated (value2014+value2016)/2, mean for the year 2017 was calculated (value2015+value2017)/2. For the estimated the year 2018 was added the difference between the means of the last two years to the mean of the year 2017: mean2017+(mean2017-mean2016). A detailed description of the production of the indicators is described in the Methods section, chapter 3.1. Multispecies indicators estimation for the 2020 Indicators Update.
The supranational species indices were not updated in 2020. The computation procedure of the individual species indices undertaken in 2019 is described in the Methods section, chapter 1. National species indices and trends (computation of national species indices) and chapter 2. Supranational species indices and trends (computation of supranational – European and regional – species indices).
Indicators (multi-species indices) until the year 2017 were computed in 2019 using MSI-tool (R-script) for calculating of Multi-Species Indicators (MSI) and trends in MSIs. The method of the calculation is described in Soldaat et al. (2017). Either European, EU, or regional species indices including their standard errors are used as source data. The smoothed indicators for a period till 2018 are presented in graphs at the website and smoothed indicators including their lower and upper confidence limits for the periods until 2017 may be shown, too (if you select the option) and are available for download at the website (see below). A detailed description of the production of the indicators is described in the Methods section, chapter 3. Multispecies indicators.
Species habitat classification
Species habitat classification for main habitat types (farmland, forest, and other) has been developed using improved procedure accepted at the PEBCMS workshop in Prague in 2005. We used two versions of species habitat classification – single European and BioGeo regional species habitat classification. Detailed information including the list of species with their habitat classification is provided in the Methods section, chapter 3, Box Species selection, and classification.
Results
In the tables, you can find the set of main European, EU, and regional smoothed indicators produced in 2019 and 2020.
For the complete information on an indicator (graph, list of species, and list of countries), tick the checkbox at the left side of the indicator name in the column Indicator and click on the button Show above the table.
For drawing and comparing graphs for several indicators at once, tick the checkboxes at the left side of indicator names and choose All data in one graph – the option “yes”. Click the button Show above the table to confirm and proceed with your selection. You can also quickly deselect your choice (Reset).
At each presentation of the indicator´s graph, you can check the list of species and their trends as well as the List of countries.
On the left side of each indicator graph, the numbers of species in each indicator that are declining (moderately or steeply declining), increasing (moderately or strongly increasing), stable and uncertain are presented.
Download the latest indicators
The set of the main indicators for Europe and the EU is now freely available for download in Excel sheet (Data provision and co-authorship policies apply). When using the data we would be grateful if you could please acknowledge the data source as EBCC/BirdLife/RSPB/CSO.
We appreciate your help to keep evidence of the usage of our results. For this purpose, please fill in the simple registration form after you download the data files.
It is possible to download both files 2019 Indicators Update for the time period until 2017 and the 2020 Indicators Update for the time period until 2017 plus estimates for 2018.
Please, note that the data is licensed under a Creative Commons license CC BY-NC 4.0 and is governed by applicable copyright law (Creative Commons Legal Code). Creative Commons. January 9, 2008. Retrieved February 22, 2010.
Note: We recommend cautious interpretation of year by year changes in the indicators values and readers should also pay attention to lists of species and countries. For any use of the results presented in this report, we strongly recommend consulting the PECBMS coordination unit (klvanova@birdlife.cz).