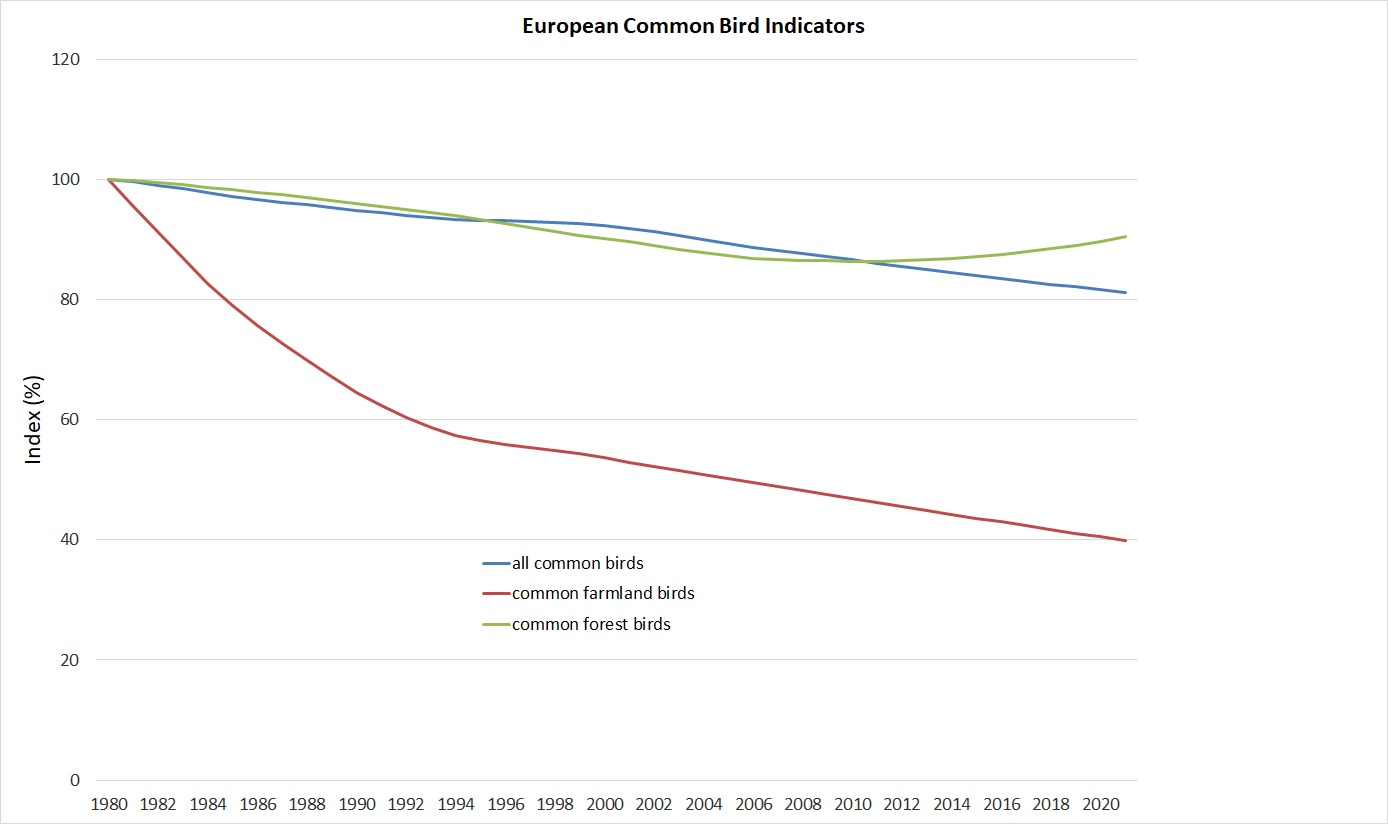
The 2022 Indicators Update shows overall decline in common birds breeding in Europe, while most pronounced is the decline in the farmland species.
European common bird indicators, 2022 update
November 23, 2022
The Pan-European Common Bird Monitoring Scheme (PECBMS) presents a set of updated European common bird indicators covering the period of 1980–2021. The outputs based on the data for 168 common bird species come from 30 countries since we included data from Andorra for the first time. We thank all the national coordinators for their efforts to cope with the new programs and the thousands of volunteers counting birds in the field.
The 2022 Indicators Update shows overall decline in common birds breeding in Europe, while most pronounced is the decline in the farmland species.
We computed the indicators for Europe and its regions (West, North, Central & East and South Europe), EU, New and Old EU states for common farmland, forest, and all common birds.
Due to Brexit in February 2020, we calculated all EU bird indicators by excluding data from the United Kingdom. We removed the UK data from the whole time series to create the indicators without the country that is no longer considered a part of the EU. EU indicator calculation without the UK was done for the first time in the 2022 update (the 2021 update was based on data until 2019, when the UK was still an EU Member State). It is possible to compare the ‘EU indicator without the UK’ and ‘EU indicator with the UK’ in one graph on the PECBMS web.
We used the Single European and BioGeo regional species habitat classifications to assess whether each bird species belongs to farmland, forest, or another indicator.
Download the latest European and EU indicators until 2021. The European indicator was calculated in the usual way, with the UK included. However, UK data was removed from the whole time series for EU indicator calculation (Data provision and co-authorship policies apply).
Data
We used the indices of common European birds to compute European indicators. We used the regional and EU individual species indices to calculate regional indicators for West, North, Central & East, South Europe or EU, and New and Old EU states. The EU and Old EU supranational indices are based on the EU countries excluding the United Kingdom (due to Brexit in 2020). Although we produce indices for 170 species, we remove Cyprus wheatear Oenanthe cypriaca and Cyprus warbler Sylvia melanothorax from the computation of the indicators because the two species are endemic in Cyprus. Therefore, we included only 168 species in the common bird indicators.
The number of species included in the common farmland bird indicators (39 farmland species) and common forest bird indicators (34 forest species) for Europe and the EU remained the same as last year.
Methods
We describe the computation procedure of the individual species indices in the Methods section, chapter 1. National species indices and trends (computation of national species indices) and Chapter 2. Supranational species indices and trends (calculation of supranational – European and regional – species indices).
We compute the indicators (multispecies indices) using MSI-tool (R-script) for calculating of Multi-Species Indicators (MSI) and trends in MSIs following Soldaat et al. (2017). European, EU, or regional species indices, including standard errors, are used as source data.
In graphs on the website, we present the smoothed indicators, including their lower and upper confidence limits, and also unsmoothed values of the indicators for the period from 1980 onward. All these values are also available for download on the website (see below). We describe the production of the indicators in detail in the Methods section, chapter 3—multispecies Multispecies indicators.
Species habitat classification
Species habitat classification for main habitat types (farmland, forest, and others) has been developed using improved procedures accepted at the PEBCMS workshop in Prague in 2005. We used two versions of species habitat classification – single European and BioGeo regional species habitat classification. Detailed information, including the list of species with their habitat classification, is provided in the Methods section, chapter 3, Box Species Selection and Classification.
Results
The tables contain the main European, EU, and regional smoothed indicators produced in 2022.
For the complete information on an indicator (graph, list of species, and list of countries), tick the checkbox at the left side of the indicator name in the column Indicator and click on the button Show above the table.
For drawing and comparing graphs for several indicators at once, tick the checkboxes at the left side of indicator names and choose All data in one graph – the option “yes”. Then, click the button Show above the table to confirm and proceed with your selection. You can also quickly deselect your choice (Reset).
It is possible to check the list of species, their trends, and the list of countries at each presentation of the indicator´s graph.
On the left side of each indicator graph, the numbers of species in each indicator that are declining (moderately or steeply declining), increasing (moderately or strongly increasing), stable and uncertain are presented.
As a result of the UK data removal, all the EU bird indicators have changed (compared to the previous updates of EU indicators that have included the UK data). The most visible change (8% difference between the ´EU without the UK´ and ´EU with the EU´ indicators) happened in the Farmland indicator. It is possible to compare the ‘EU indicator without the UK’ and ‘EU indicator with the UK’ in one graph on the PECBMS webpage.
Download the latest indicators
The main indicators for Europe and the EU are freely available to download in Excel sheets (Data provision and co-authorship policies apply).
Download the latest European and EU indicators until 2021. Be aware! The European indicator was calculated in the usual way, with the UK included. However, UK data was removed from the whole time series for EU indicator calculation.
When using the data, we would be grateful if you acknowledged the data source as EBCC/BirdLife/RSPB/CSO. Thank you.
We appreciate your help in keeping evidence of the usage of our results. For this purpose, please fill in the simple registration form after downloading the data files.
Note that the data is licensed under a Creative Commons license CC BY-NC 4.0 and is governed by applicable copyright law (Creative Commons Legal Code). Creative Commons. January 9, 2008. Retrieved February 22, 2010.
Note: We recommend a cautious interpretation of changes in the indicators’ values year by year, and readers should also pay attention to lists of species and countries. For any use of the results presented in this report, we strongly recommend you consult the PECBMS coordination unit (klvanova@birdlife.cz).

Since 1980, we have lost 60% of farmland birds, 19% of forest birds and 10% of all common birds.