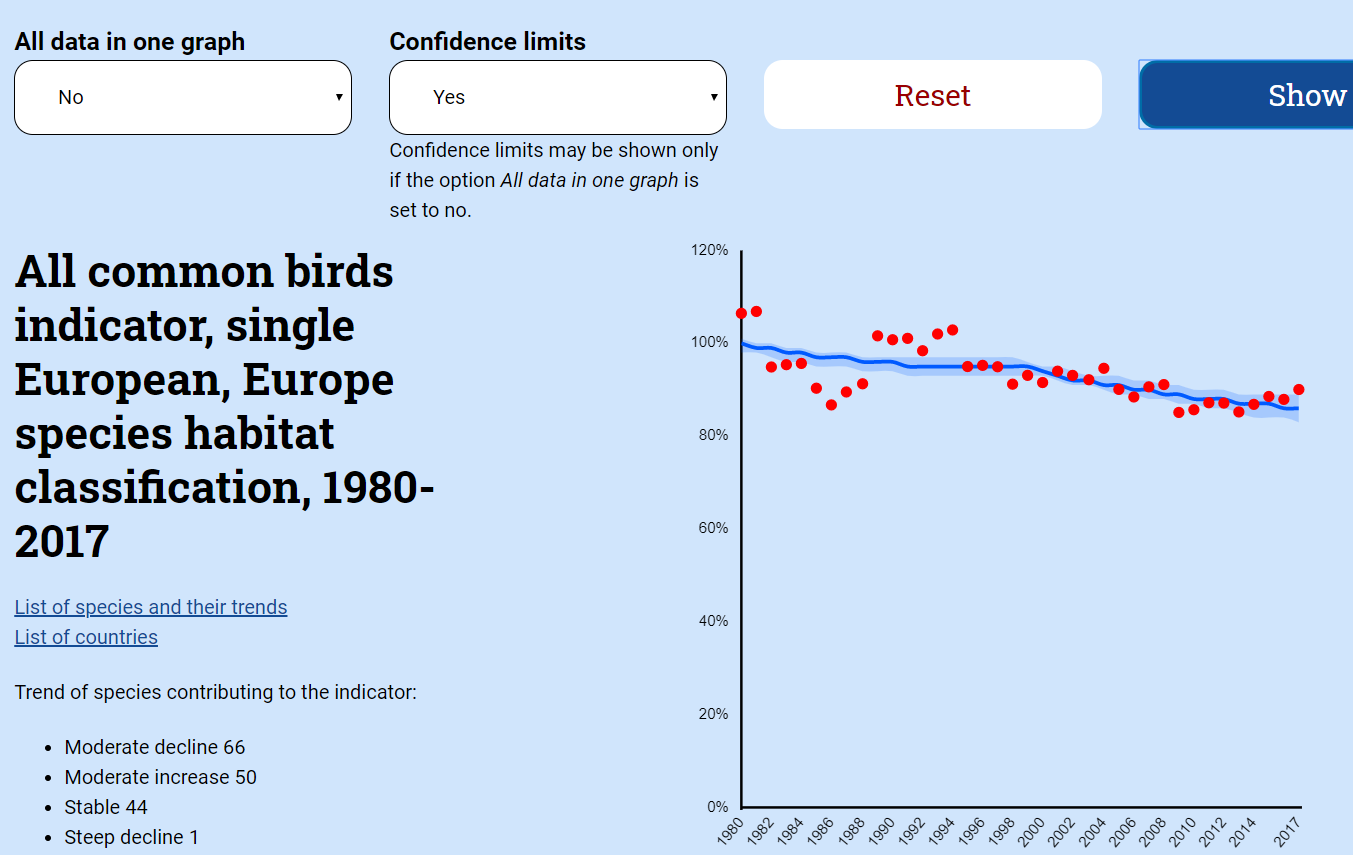
In this update, the smoothed indicators and their lower and upper confidence limits for the time periods from 1980 onwards are presented in graphs on the website.
What is new in 2019 data update?
December 6, 2019
In 2019, the indices and trends for 170 common European species have been produced based on the data from 28 countries. The number of species published and the countries contributing to the PECBMS in 2019 remained the same as the last year.
In this update, the smoothed indicators and their lower and upper confidence limits for the time periods from 1980 onwards are presented in graphs on the website.
Indices of Luxembourg have been updated up to the year 2016 and indices of France have been updated up to the year 2017.
Belgium, Portugal, and Romania delivered data up to 2018. Unfortunately, these data could not be used for indicator calculation due to methodological reasons. Older data up to the year 2014 (Portugal) or up to 2016 (Belgium, Ireland, Romania) was used instead and therefore these countries did not fall out of indicator calculation. The newest update will be used again in the future.
The species indices are presented in graphs including their lower and upper confidence limits for the time periods from 1980-onwards as a former year. All such data are also available for download in a table called Europe_IndicesAndTrends_2019.
Again, two species (Oenanthe cypriaca and Sylvia melanothorax) haven´t been included in all common bird indicators for Europe and EU, as they are endemic species for Cyprus and not common for whole Europe. Consequently, only 168 species are included in common bird indicators. The number of species included in common farmland and common forest bird indicators for Europe and the EU remained unchanged (39 farmland species and 34 forest species). Nothing has changed according to the former year. In this update, we again used a tool to calculate multi-species indices (indicators) developed in Statistics Netherlands). The tool produces the same outputs as in the previous updates of the indicators and also the smoothed values with confidence intervals. For more details on the tool and statistical procedure please check Soldaat, L.L., J. Pannekoek, R.J.T. Verweij, C.A.M. van Turnhout & A.J. van Strien. 2017. A Monte Carlo method to account for sampling error in multi-species indicators. Ecological Indicators. PDF
The smoothed indicators and their lower and upper confidence limits for the time periods from 1980-onwards are presented in graphs on the website. All such data for the time periods from 1980-onwards and 1990-onwards are available for download in a table.
Besides this, computation procedure, data quality control, and presented indices, trends and indicators have not undergone any change, all have been kept consistent with last year’s data update. To see news from 2018 see What is new in the 2018 data update?