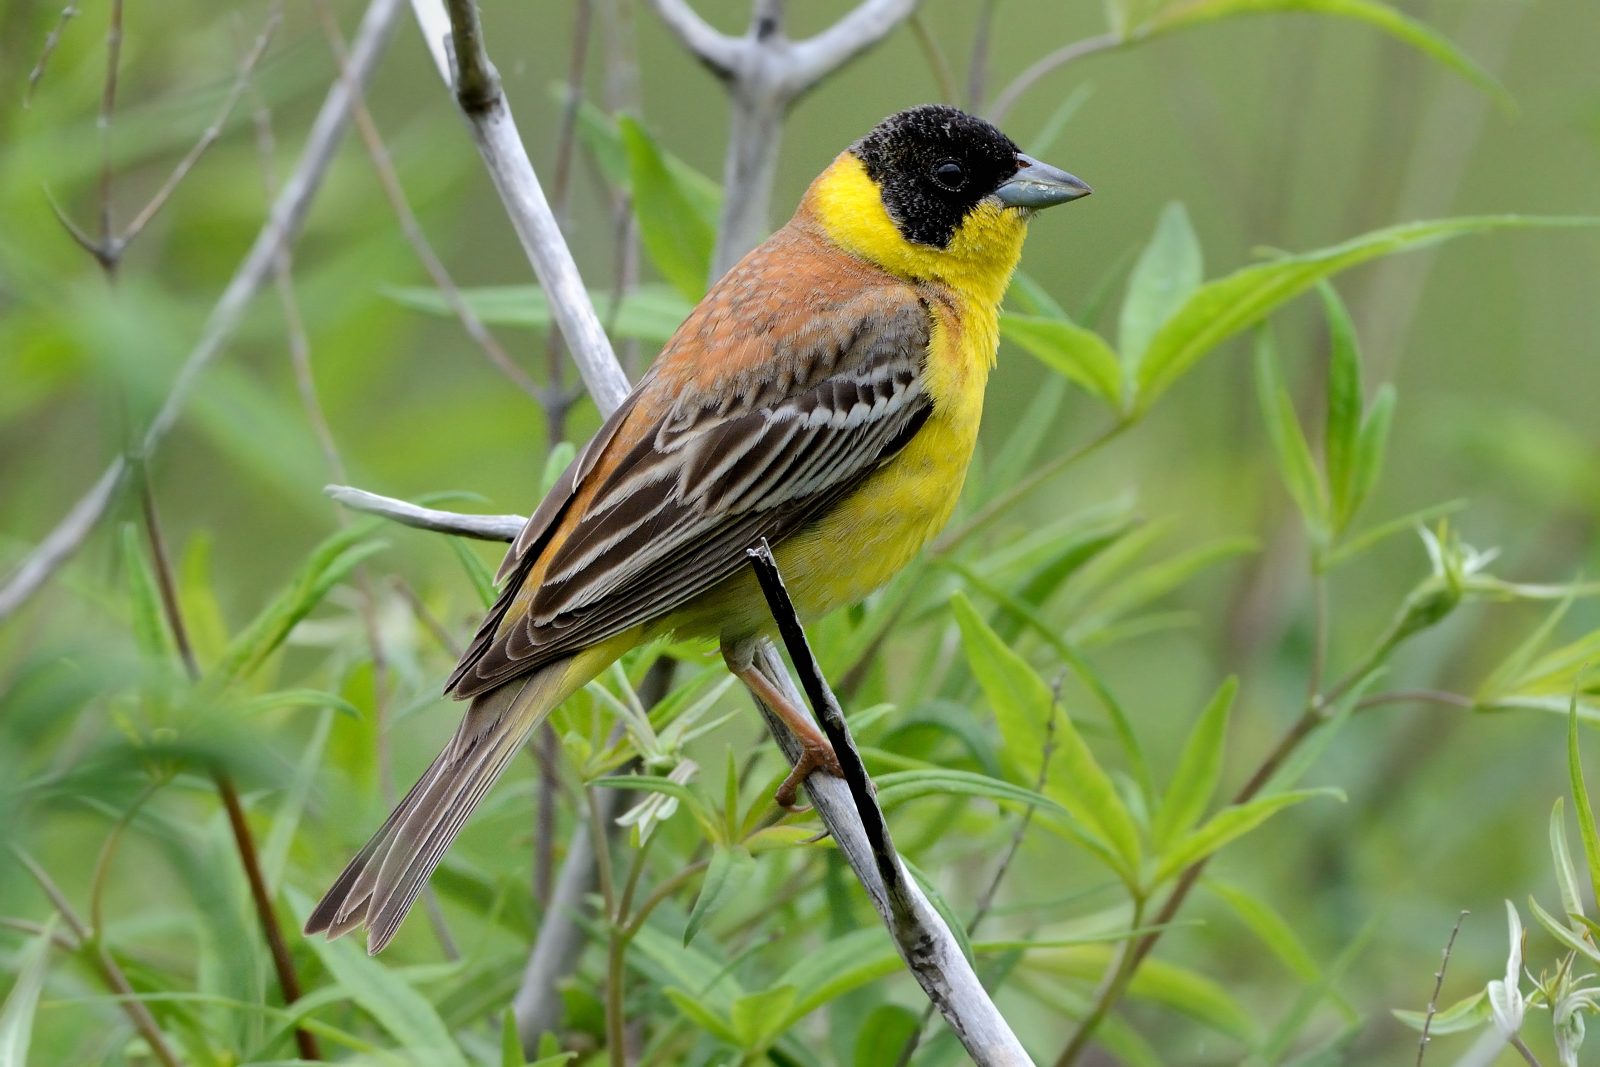
Black-headed bunting, a species typical of the South-East European PECBMS countries, is declining. The decline has been documented since the 1970s. The population trend, however, contrasts with the expansion of the breeding range in Europe (EBBA2). To better understand the trends and changes in distribution, high-quality data from Southeast Europe is needed. However, in many countries, monitoring is in early stages of development or is absent, and populations of this species, which are remarkably abundant, are not receiving sustainable support. Continuation of a programme of International Census Plots and support for monitoring in relevant countries, e.g., via the EBCC Small Grant Fund, would undoubtedly improve the situation.
Photo by Pavel Štěpánek
Trends of wild birds in Europe, 2025 update
December 15, 2025
This report presents updated population trends and indices for 170 wild bird species in Europe for the period 1980–2024, produced by the Pan-European Common Bird Monitoring Scheme (PECBMS) in 2025. The report presents species trends over two periods – the long-term period (1980–2024) and the most recent ten years (2015–2024).
Black-headed bunting, a species typical of the South-East European PECBMS countries, is declining. The decline has been documented since the 1970s. The population trend, however, contrasts with the expansion of the breeding range in Europe (EBBA2). To better understand the trends and changes in distribution, high-quality data from Southeast Europe is needed. However, in many countries, monitoring is in early stages of development or is absent, and populations of this species, which are remarkably abundant, are not receiving sustainable support. Continuation of a programme of International Census Plots and support for monitoring in relevant countries, e.g., via the EBCC Small Grant Fund, would undoubtedly improve the situation.
Photo by Pavel Štěpánek
Download European species indices and trends up to 2024 (Data Provision and Co-Authorship Policies apply).
Acknowledgements
The production of European and EU indices, trends, and indicators would not be possible without the tremendous effort of the coordinators of national breeding bird surveys and the many volunteer observers who collect the field data. PECBMS also receives regular support from numerous individuals and organisations through their advice and assistance.
A complete list of contributors and partner organisations is provided in the Acknowledgements.
Data
In 2025, reliable European indices were produced for 170 species – the same number as in the 2024 update.
National data for this update were provided by 30 countries:
Andorra, Austria, Belgium, Bulgaria, Croatia, Cyprus, Czechia, Denmark, Estonia, Finland, France, Germany, Greece, Hungary, Italy, Latvia, Lithuania, Luxembourg, the Netherlands, Norway, Poland, Portugal, the Republic of Ireland, Romania, Slovakia, Slovenia, Spain, Sweden, Switzerland, the United Kingdom.
Data coverage periods differ between countries. A general overview of the monitoring periods by country is provided in Methods, Chapter 2.3: Types of Supranational Results Produced by PECBMS. However, within a single country, the length of available national data may vary by species. Therefore, for each species, we list the countries and the corresponding national data periods in the individual species graphs (accessible through the Countries pop-up window).
Methods
European species trends and indices are calculated from national population indices and trends provided by coordinators of the national bird monitoring schemes participating in the PECBMS network.
A standard procedure consists of several steps.
National coordinators calculate national trends and indices from field data collected by skilled volunteer counters in accordance with standard protocols. While field counting methods vary by country, national coordinators analyse species trends using RTRIM-shell, an R-based version of the TRIM tool (Trends and Indices for Monitoring data, link), developed by Statistics Netherlands specifically for monitoring datasets. This tool adjusts for field-methodological differences, ensuring standardised, comparable bird indices and trends across Europe, produced using a tailor-made implementation of loglinear regression models (RTRIM models) from time series of recorded species counts at the study plots. The main advantages of RTRIM models are that they account for both site and year effects, and they can estimate missing values (counts for sites that were not counted in particular years) based on trends from other monitored sites.
National trends and indices are aggregated into supranational species trends and indices (e.g., regional, European, and EU) by the PECBMS coordination unit. The RSWAN tool is commonly used for this purpose. Its advantage is stepwise completion of countries into regions and then to the European or EU level. Countries produce their national indices over uneven time periods; therefore, imputing missing years for countries with shorter datasets is required during the supranational index calculation in RSWAN. European and EU indices are calculated by grouping the countries into regions with similar natural conditions, agriculture, and history (a stepwise procedure). This hierarchical process first enables estimation of missing years for countries using comparable data from neighbouring countries within a region, and subsequently calculates regional indices as realistically as possible. Imputation is used for all missing years in the dataset, and this procedure is analogous to the estimation of missing values in the bird surveys when calculating national indices in the RTRIM shell. The overview of the grouping of countries in the stepwise procedure for Europe and the EU is given in the PECBMS computation schedule. However, for each species, only the countries that provided high-quality data for that species are included in the calculation (the list of countries is presented in the species’ graph via the pop-up window titled Countries).
To account for the fact that different countries/regions hold different proportions of European population for each species, we weigh the national/regional population indices by national/regional population size estimates published in the European Red List of Birds (ERLoB 2021), complemented when necessary with regional (sub-national) population sizes provided by the national coordinators.
The procedure also includes an extensive data quality check, implemented at each stage of data collation and analysis. First, the national coordinators review the national-level data (species counts, indices, time totals, and trends) for calculation errors and weak and suspicious data. The PECBMS coordinator rechecks the national data, with particular attention to the consistency of indices and time totals with the previous dataset update. After supranational indices and trends are produced, their consistency is assessed as was done for national data. If the PECBMS coordinators identify inconsistencies, they examine them in detail to determine whether they arise from the dataset being enlarged or improved, or from a computation error.
A detailed description of the computation steps and the full PECBMS methodology is provided in the Methods section.
Results
We present indices, long-term and ten-year trends, and slopes for 170 European breeding species via an interactive table. The table summarises the updated long-term and ten-year trends and slopes for European species, along with each species’ habitat classification.
The Long-term Slope is calculated over the longest available period for each species index; the starting year ranges from 1980 to 2006 (as indicated by superscripts next to the species name in the table). Correspondingly, the Long-term Trend represents the percentage change in the smoothed index value between the first and last year of this period. Smoothing is used to avoid abrupt shifts in the Trend between updates caused by natural year-to-year fluctuations in the species index.
The Ten-year Slope is calculated over the most recent ten-year period, 2015–2024. Likewise, the Ten-year Trend shows the percentage change in the smoothed index value between the first and last year of this period.
Graphs of European species indices are available by clicking on the species names in the table and confirming the selection with the Show button. Trend classification for the Long-term Slope, along with a list of countries contributing data to each European species index, can be accessed via the species graph.
All species are assigned to one of the main habitat types – farmland, forest, or other. This classification is based on the PECBMS single European species habitat classification adopted at the 2005 PECBMS workshop in Prague. Detailed information, including the species list and their habitat classification, can be found in the Methods section, Chapter 3, Box Species Selection and Classification.
The scientific and common names, and the taxonomic order of species used in the table, follow the latest HBW and BirdLife Taxonomic Checklist.
Download and reference
PECBMS European bird species indices and trends are freely available for download as an Excel file (Data Provision and Co-Authorship Policies apply).
We kindly ask that you acknowledge the data source as EBCC/BirdLife/RSPB/CSO whenever you use the data.
Recommended citation for the PECBMS 2025 update:
PECBMS 2025. The State of Europe´s Wild Birds 2025. CSO, Prague, Czech Republic. (download as PDF)
Following each update, we also upload the latest PECBMS results to the Zenodo repository, supplementing the data paper by Brlík, V. et al., published in 2021.
The data is licensed under a Creative Commons license CC BY-NC 4.0 and is governed by applicable copyright law (Creative Commons Legal Code). Creative Commons. January 9, 2008. Retrieved February 22, 2010.
Note: We recommend interpreting year-to-year changes in index values with caution. Readers should pay attention to the species legend. We strongly advise consulting the PECBMS coordinator, Eva Šilarová (silarova@birdlife.cz), before using the results presented in this report.